How to Reduce Energy Loss with Smart PV Management in 2026?

Time:2026-10-11 Author:Isabella
0%

How to Reduce Energy Loss with Smart PV Management in 2026?

Solar panels do not lose energy only because of weak sunlight. Losses also appear when production exceeds local demand, batteries reach full charge, or inverters operate beyond their practical limits. At noon, a rooftop system may produce 80 kilowatts while the building uses only 45. Without intelligent control, the remaining power may be curtailed or exported at a poor value.

This is where How smart PV management reduces energy loss becomes a practical question for 2026. Smart management combines weather forecasts, real-time load data, inverter settings, battery state of charge, and grid signals. It can shift water heating to sunny hours, limit unnecessary inverter clipping, and reserve battery capacity for an approaching cloud front. Small decisions matter.

Clouds move quickly.

The system must respond.

Fatih Birol, Executive Director of the International Energy Agency, has said, “Solar PV is the cheapest source of electricity in history.” That advantage is not automatic. Poor forecasting can still create avoidable waste. Batteries also consume energy during charging and discharging. A control platform may reduce losses, but it cannot erase them.

This article examines practical methods for improving PV performance in 2026. It considers predictive control, battery coordination, voltage management, and human oversight. Field operators remain important. A dashboard can flag abnormal temperature or rapid output changes, but experienced staff must interpret the cause.

The uncomfortable point is simple: smarter software can expose weaknesses rather than solve everything. Reliable results require accurate meters, maintained equipment, transparent performance data, and regular review. Efficiency should be measured at the system boundary, not claimed from a single inverter screen.
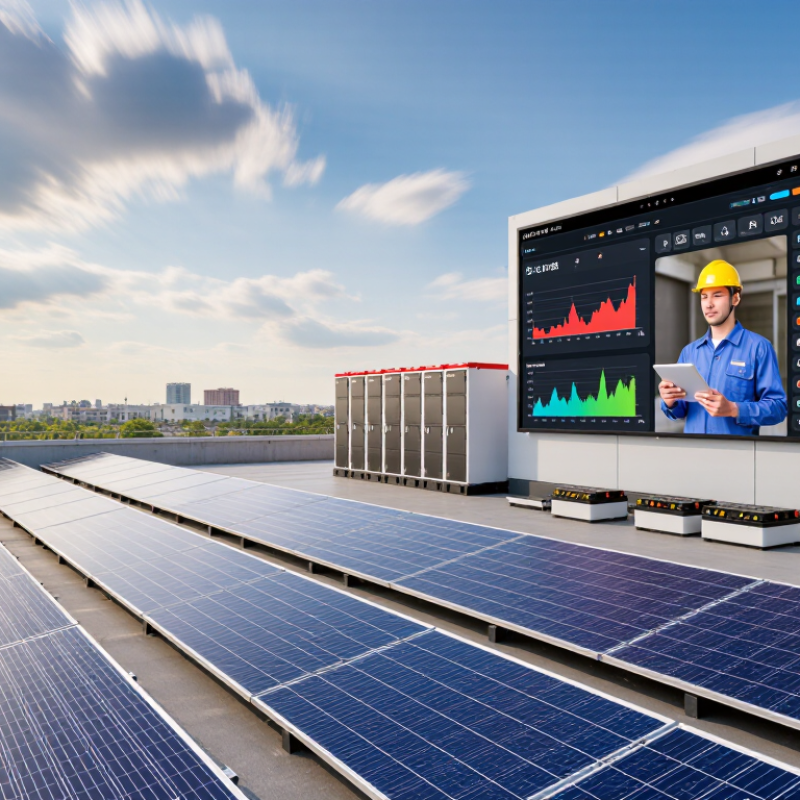
How to Reduce Energy Loss with Smart PV Management in 2026?

Understanding Energy Loss in Smart PV Systems

Energy loss in smart PV systems rarely comes from one dramatic failure. It accumulates quietly through heat, dust, shading, wiring, mismatch, and inverter limits. The National Renewable Energy Laboratory’s PVWatts documentation applies a default system-loss assumption of about 14%. That figure includes soiling, shading, mismatch, wiring, availability, and degradation.

A dusty 10 kW rooftop may lose visible output before anyone notices. Smart meters can compare each string’s voltage, current, and temperature every few minutes. This helps separate a dirty panel from a failing connector. Maximum power point tracking also adjusts operating voltage as sunlight changes.

However, monitoring alone does not recover lost energy. Someone must inspect the alarm, clean the array, or correct the underlying fault. Models fail.

Long-term degradation deserves attention. An earlier National Renewable Energy Laboratory analysis found a median PV degradation rate near 0.5% per year across reviewed systems. IEA PVPS Task 13 research also treats degradation as a key factor in lifetime yield assessments. Smart management can reduce avoidable losses by forecasting heat, shifting flexible loads, and limiting unnecessary inverter clipping. Yet aggressive control may create new losses when forecasts are wrong. A practical site review should compare measured yield against temperature, irradiance, soiling, and curtailment records. The result is less impressive than a perfect dashboard, but more reliable.

Assessing PV Performance and Identifying Major Loss Sources

How to Reduce Energy Loss with Smart PV Management in 2026?

Assessing PV performance starts with measured output, not assumptions. Compare daily generation with irradiation, temperature, and inverter availability. The performance ratio reveals hidden underperformance. According to IEA PVPS Trends 2024, global photovoltaic capacity exceeded 1.6 terawatts by the end of 2023. Even small losses now affect substantial energy volumes.

Soiling is often visible, but its impact is easy to underestimate. Dust, pollen, and bird deposits can reduce production by several percentage points between cleaning cycles. Thermal losses also increase on hot module surfaces. Check rear ventilation, shading, and abnormal temperature differences. NREL’s degradation review reports a median annual PV degradation rate near 0.5%. That figure is useful, but individual sites can perform worse.

Smart management should separate technical loss sources. Compare string currents to identify mismatch, shading, or damaged modules. Review clipping during high-irradiance hours. Check whether downtime comes from equipment faults or communication gaps. IEA PVPS Task 13 reports that availability, soiling, shading, and component degradation remain recurring causes of yield loss. A practical dashboard should flag unusual patterns within hours, not months. However, automated alerts can mislead when sensors drift. Manual inspections still matter. This is where many energy assessments remain imperfect.

Choosing Smart Monitoring and Energy Management Technologies

In 2026, reducing PV energy loss begins with selecting smarter monitoring and energy management technologies. The IEA’s Renewables 2024 report recorded about 420 gigawatts of new solar capacity in 2023. More installations mean more hidden performance gaps. A useful platform should track inverter output, irradiance, module temperature, weather, and grid conditions together. Small signals matter. A five-minute output drop may indicate shading, soiling, or a failing connection.

Effective software compares actual production with a site-specific expected curve. It should then send a clear alert, not merely display another dashboard. A widely cited NREL study found a median PV degradation rate near 0.5% annually. Without historical baselines, operators may mistake gradual decline for normal variation. Energy management systems can also shift flexible loads toward sunny periods, reducing curtailment and unnecessary grid purchases. However, automated control still needs human review. I would not treat every alert as truth.

Technology selection deserves practical testing. Choose systems with open communication protocols, exportable data, role-based access, and secure updates. The IEA PVPS Trends 2024 report estimated global PV capacity exceeded 1.6 terawatts by the end of 2023. At this scale, disconnected monitoring tools create expensive blind spots. A small commercial site might need only reliable sensors and a simple controller. A large site may require forecasting, battery coordination, and fleet-level analytics. Start with a baseline month, inspect sensors physically, and verify savings against meter data. Dashboards can look impressive while one dirty sensor quietly misleads the entire operation.

How to Reduce Energy Loss with Smart PV Management in 2026?

Choosing Smart Monitoring and Energy Management Technologies

The chart compares modeled annual PV energy losses by category. Smart monitoring can reduce avoidable losses such as inverter clipping and system downtime through real-time alerts, predictive maintenance, and optimized operating set points. Physical losses, including temperature, wiring, soiling, and module mismatch, require separate engineering or maintenance actions.

Planning benchmark, not a site measurement. Categories are based on standard PV performance-loss classifications used in NREL PVWatts modeling; actual results vary by climate, system design, maintenance, and operating conditions.

Optimizing Solar Generation, Storage, and On-Site Consumption

Smart PV management begins by measuring where solar energy is lost. A rooftop system may produce plenty at noon, while appliances remain idle. Smart meters reveal this mismatch in real time. Production forecasts also help operators schedule flexible loads before surplus power is curtailed. Timing matters.

Storage should absorb excess generation without operating blindly. A control system can charge batteries during midday and reserve capacity for evening demand. It should consider battery temperature, state of charge, weather, and household consumption. Poor timing creates avoidable conversion losses. Sometimes, using solar directly is more efficient than storing it.

On-site consumption offers the clearest savings. Water heaters, pumps, ventilation, and vehicle charging can run during strong production hours. Automated controls should respect comfort, safety, and equipment limits. A practical setup needs clear data, tested sensors, and regular performance checks. One faulty meter can distort the entire strategy. Field experience also shows that forecasts are never perfect. Clouds move quickly, and real households change habits. Reviewing energy curves each week helps correct assumptions and improve control rules. The best system is not always the most aggressive one. It is the one that reduces waste without creating new operational problems.

Maintaining and Improving Smart PV Performance in 2026

How to Reduce Energy Loss with Smart PV Management in 2026?

Maintaining and Improving Smart PV Performance in 2026 requires regular observation, not occasional repairs. During routine inspections, technicians should compare panel output, inverter temperature, irradiance, and battery behavior. A small shading problem can reduce production for months if monitoring alerts are ignored. Small losses accumulate. Dust, loose connections, and aging cables also deserve attention. Use calibrated sensors and keep maintenance records with dates, weather conditions, and measured output. Reliable data makes technical decisions more defensible.

Tips: Set practical alert limits for abnormal voltage, temperature, and sudden output changes. Review alerts weekly, rather than reacting to every notification. Clean panels according to local dust levels and water restrictions. Check drainage after heavy rain. Keep firmware updated through verified procedures, and restrict system access to trained personnel. Never assume a dashboard reading is correct; compare it with physical inspections and meter data.

Performance improvement is not always about adding equipment. Better tilt adjustments, clearer airflow around inverters, and timely component replacement may deliver greater value. I once used a rigid maintenance schedule that ignored seasonal dust, and it created unnecessary inspections. That approach needed revision. Field conditions change. Solar forecasts can also be wrong. When production falls, check weather, shading, grid conditions, and equipment records before replacing parts. Document uncertain findings honestly, then arrange a qualified review when measurements disagree.

How to Reduce Energy Loss with Smart PV Management in 2026? - Maintaining and Improving Smart PV Performance in 2026

Energy-Loss Area Typical Impact on Annual PV Yield* Smart Management Method Recommended Performance Indicator Practical Action in 2026 Potential Recovery Range*
Soiling and surface contamination 2%–6%; higher in dry, dusty, or agricultural environments Compare irradiance-adjusted output before and after cleaning; use visual inspections and soiling sensors where justified Soiling ratio and daily performance ratio Set cleaning thresholds based on measured yield loss instead of using a fixed calendar schedule 1%–4%
Partial shading and vegetation growth 1%–5%; localized shading can affect mismatch losses more severely Use time-series power data, site imagery, and shade mapping to identify recurring production dips String-level deviation from the site baseline Trim vegetation, remove obstructions, and review seasonal shade changes at least quarterly 0.5%–3%
Module degradation and mismatch Approximately 0.3%–0.8% per year after commissioning, depending on module and climate Track normalized module or string output and compare like-for-like sections of the array Year-over-year normalized energy yield Use module-level alerts to prioritize inspection of abnormal sections before broad replacement 0.2%–1% annually through targeted maintenance
Inverter clipping and thermal derating 1%–4%, depending on DC-to-AC sizing, ambient temperature, and operating profile Analyze high-irradiance intervals, inverter temperature, and clipped-power duration Clipping hours, inverter availability, and temperature-adjusted efficiency Optimize set points, ventilation, firmware settings, and dispatch where technically permitted 0.5%–2%
Electrical resistance and connection faults 0.5%–2%; severe faults may cause larger localized losses or safety risks Combine current-voltage trends, thermal imaging, insulation testing, and alarm history String current imbalance and connector temperature deviation Inspect abnormal strings promptly and retorque or replace defective components according to electrical standards 0.3%–1.5%
Unplanned downtime and delayed fault response 1%–5%, depending on site size, accessibility, and response time Use automated alerts, escalation rules, remote diagnostics, and a documented maintenance workflow Availability, mean time to detect, and mean time to restore Set priority levels for critical alarms and review unresolved events every operating day 0.5%–3%
Weather and sensor-data errors 1%–3% apparent underperformance caused by inaccurate normalization or faulty sensors Validate irradiance, module temperature, wind, and meter data against redundant or reference measurements Data completeness, sensor deviation, and model residual error Calibrate sensors, flag missing data, and prevent unverified readings from driving maintenance decisions 0.5%–2%
Grid curtailment and export constraints 0%–10% or more where network capacity is limited or curtailment is frequent Coordinate PV output with load forecasts, export limits, flexible loads, and energy storage Curtailed energy, export-limit hours, and self-consumption ratio Schedule controllable loads during solar-production periods and use storage when economically and technically suitable 2%–8% of otherwise available energy
Reactive power and voltage-management losses Generally below 1%–2%, but may increase on long or weak distribution feeders Monitor voltage, power factor, reactive power, and inverter operating limits Voltage excursions, power factor, and feeder-loss trend Tune voltage-support settings in coordination with grid requirements and qualified personnel 0.1%–1%

*Values are indicative industry benchmark ranges, not guaranteed results. Actual losses depend on system design, climate, equipment condition, grid requirements, operating procedures, and data quality. Loss categories may overlap and should not be added directly.

FAQS

How should PV performance be measured accurately?

Compare daily energy output with sunlight, temperature, and inverter availability. A performance ratio can reveal hidden losses. Do not trust assumptions alone.

Which issues commonly reduce solar generation?

Dust, pollen, bird deposits, shading, heat, component aging, and equipment downtime can reduce output. Even a thin dirty layer may lower production noticeably. Some losses remain invisible without measurements.

How can operators identify string or module problems?

Compare current levels across strings under similar sunlight conditions. Large differences may indicate shading, mismatch, damaged modules, or loose connections. Inspect unusual temperature differences. Small clues matter.

What should a smart PV monitoring system track?

It should combine inverter output, sunlight, module temperature, weather, and grid conditions. Five-minute output drops may signal shading or a failing connection. The system should compare actual production with an expected curve. A dashboard alone is not enough.

Can automated alerts always be trusted?

No. Sensor drift can create false warnings or hide real problems. Check alerts against physical inspections and meter readings. Human review still matters. I would not accept every alert as truth.

How can flexible energy use improve solar self-consumption?

Schedule water heating, pumping, ventilation, and vehicle charging during strong production hours. Smart meters can reveal idle equipment around midday. Controls must protect comfort, safety, and equipment limits. The simplest schedule may work best.

When should batteries charge or discharge?

Charge during surplus midday generation and reserve capacity for evening demand. Consider temperature, state of charge, forecasts, and household consumption. Using solar directly can sometimes waste less energy than storing it. Timing matters.

How should a PV management system be selected?

Test the system with a baseline month before judging its savings. Choose open data access, exportable records, secure updates, and user permissions. Small sites may need reliable sensors and a basic controller. Large sites may need forecasting and coordinated storage. Impressive screens can still hide bad data.

Conclusion

How smart PV management reduces energy loss begins with understanding where losses occur across the photovoltaic system. Common sources include shading, dust, temperature changes, inverter inefficiency, wiring resistance, battery charging limits, and mismatches between solar generation and household or commercial demand. By tracking real-time production, voltage, temperature, consumption, and storage status, intelligent monitoring tools can identify abnormal performance and reveal opportunities for improvement.

In 2026, effective PV management should coordinate solar generation, energy storage, and on-site consumption instead of treating them as separate functions. Automated load scheduling can shift flexible activities to periods of high solar output, while storage systems can capture surplus electricity and release it when demand rises. Regular inspections, equipment cleaning, software updates, performance comparisons, and timely maintenance help preserve efficiency over time. Combining accurate data, responsive control, and continuous optimization enables PV systems to use more generated energy, reduce avoidable losses, and maintain reliable long-term performance.

Isabella

Isabella

Isabella is a dedicated marketing professional with a sharp focus on driving brand growth and engagement through strategic content creation. With an extensive background in digital marketing, she combines her passion for storytelling with her keen understanding of industry trends to deliver......